OOM investigation
A production debugging story: from “everything is crashing” to finding a 1-line root cause buried under 12MB of tokenizer data.
The Setup
We run a Temporal TypeScript worker that manages long-running conversation workflows. Each workflow orchestrates multi-channel interactions with leads. The worker runs on ECS with 4GB task memory (~3.8GB for the container), configured with:
workflowThreadPoolSize: 2maxCachedWorkflows: 300workflowTaskSlotSupplier: { numSlots: 12 }reuseV8Context: true(default)--max-old-space-size=3072
This configuration had been stable for months. It is explained in worker configuration.
The Problem
February 6, 11am. After a routine deployment, our conversation worker instances started dying in a loop. ECS kept restarting them, they’d run for about 60 seconds, then get OOM-killed. Every single instance, every single time.
The deployment included ~25 commits: an AI SDK v5-to-v6 migration, a URL parsing refactor, a new “previously contacted” substatus, task management changes, and various smaller fixes. Nothing that screamed “memory bomb.”
Phase 1: Rule Out the Obvious
Hypothesis: Outlier Campaign Graph Loop
This was the first and longest part of the investigation, because we’d been bitten by this exact pattern before.
Each campaign in our system is modeled as a directed graph - nodes are sequence steps (send email, wait, check reply, branch on condition, etc.) and edges define the flow between them. A conversation workflow walks this graph as leads progress through the campaign. If the graph contains a cycle - a loop back to an earlier node - building the graph can cause infinite recursion. We’d had a previous incident where exactly this happened: a malformed campaign graph caused workflows to loop, their in-memory state ballooned, and the workers OOM’d.
So when the same symptoms appeared, this was the natural suspect.
Tests:
- Queried all campaigns active around the incident window (~11am Feb 6), looking for recently created or modified campaigns that could have introduced a loop.
- Inspected campaign graphs for cycles, focusing on campaigns with high conversation counts.
- Measured individual conversation workflow state and sequence payload sizes to look for the telltale ballooning pattern (a looping workflow accumulates megabytes of step history).
- Tested specific suspected campaign IDs by isolating them - checking whether stopping certain campaigns would stabilize the workers.
- Filtered to active-only conversation subsets to narrow the search.
- Cross-referenced campaign
launchedAt/updatedAttimestamps with the exact incident start time.
Result: No outlier. Conversation state sizes were normal (not the multi-MB explosion you’d see from a loop). No campaign graph had an obvious cycle. No single campaign’s removal stabilized things. The pattern didn’t fit: a graph loop causes one or a few workflows to explode, but here every instance was dying regardless of which workflows they happened to cache. This pointed away from a campaign-specific issue toward something systemic.
Still, this phase consumed significant time because the previous loop incident had been so similar in symptoms. Too much time was spent here.
Hypothesis: Retry Storm / Stuck Activities
Maybe a subset of workflows or activities were retrying aggressively and driving memory + CPU.
Tests:
- Temporal CLI checks on running workflows and pending activity attempts.
- Focus on
conversationWorkflowandconversationCallManagerWorkflow. - Added interceptor logging at activity start to capture which activities were firing, their
workflowId, and retry attempt number - this let us see if any activity was retrying excessively across the fleet. - Added workflow replay logging to detect if workflows were being replayed repeatedly (which would indicate nondeterminism errors or sticky cache eviction churn).
Result: Some noisy workflows existed, but no single smoking gun retry loop explaining cluster-wide OOM. A known nondeterminism error existed in one workflow, but a single errored workflow doesn’t explain fleet-wide memory growth. The interceptor logs showed normal activity distribution - no hot retriers dominating the fleet. Ruled out.
Hypothesis: Nondeterminism Error
The deployment included a refactor of getPublicIdentifierFromUrl that changed URL parsing behavior. In Temporal, changing the behavior of functions used in workflow code breaks replay determinism. We found 46 conversations with protocol-less URLs that would hit this.
Test: Reverted the change and deployed. Result: Still crashing. Ruled out.
Hypothesis: AI SDK v6 Memory Increase
The AI SDK upgrade was the biggest change. We measured heap usage by importing the old vs new packages in isolation.
Test: Compared process.memoryUsage().heapUsed with AI SDK v5 vs v6.
Result: +5.3MB heap difference. Not enough to explain multi-GB growth. Ruled out as sole cause.
Hypothesis: Node.js Version Change
Our Dockerfile used node:22-bookworm-slim (a moving tag). It had silently updated from 22.21.1 to 22.22.0 on Feb 3.
Test: Pinned to FROM node:22.21.1-bookworm-slim and deployed.
Result: Still crashing. Ruled out.
Phase 2: Observing the Crash Pattern
At this point, every obvious hypothesis had been eliminated. We stepped back and looked at the external monitoring data.
Sticky Cache Sawtooth
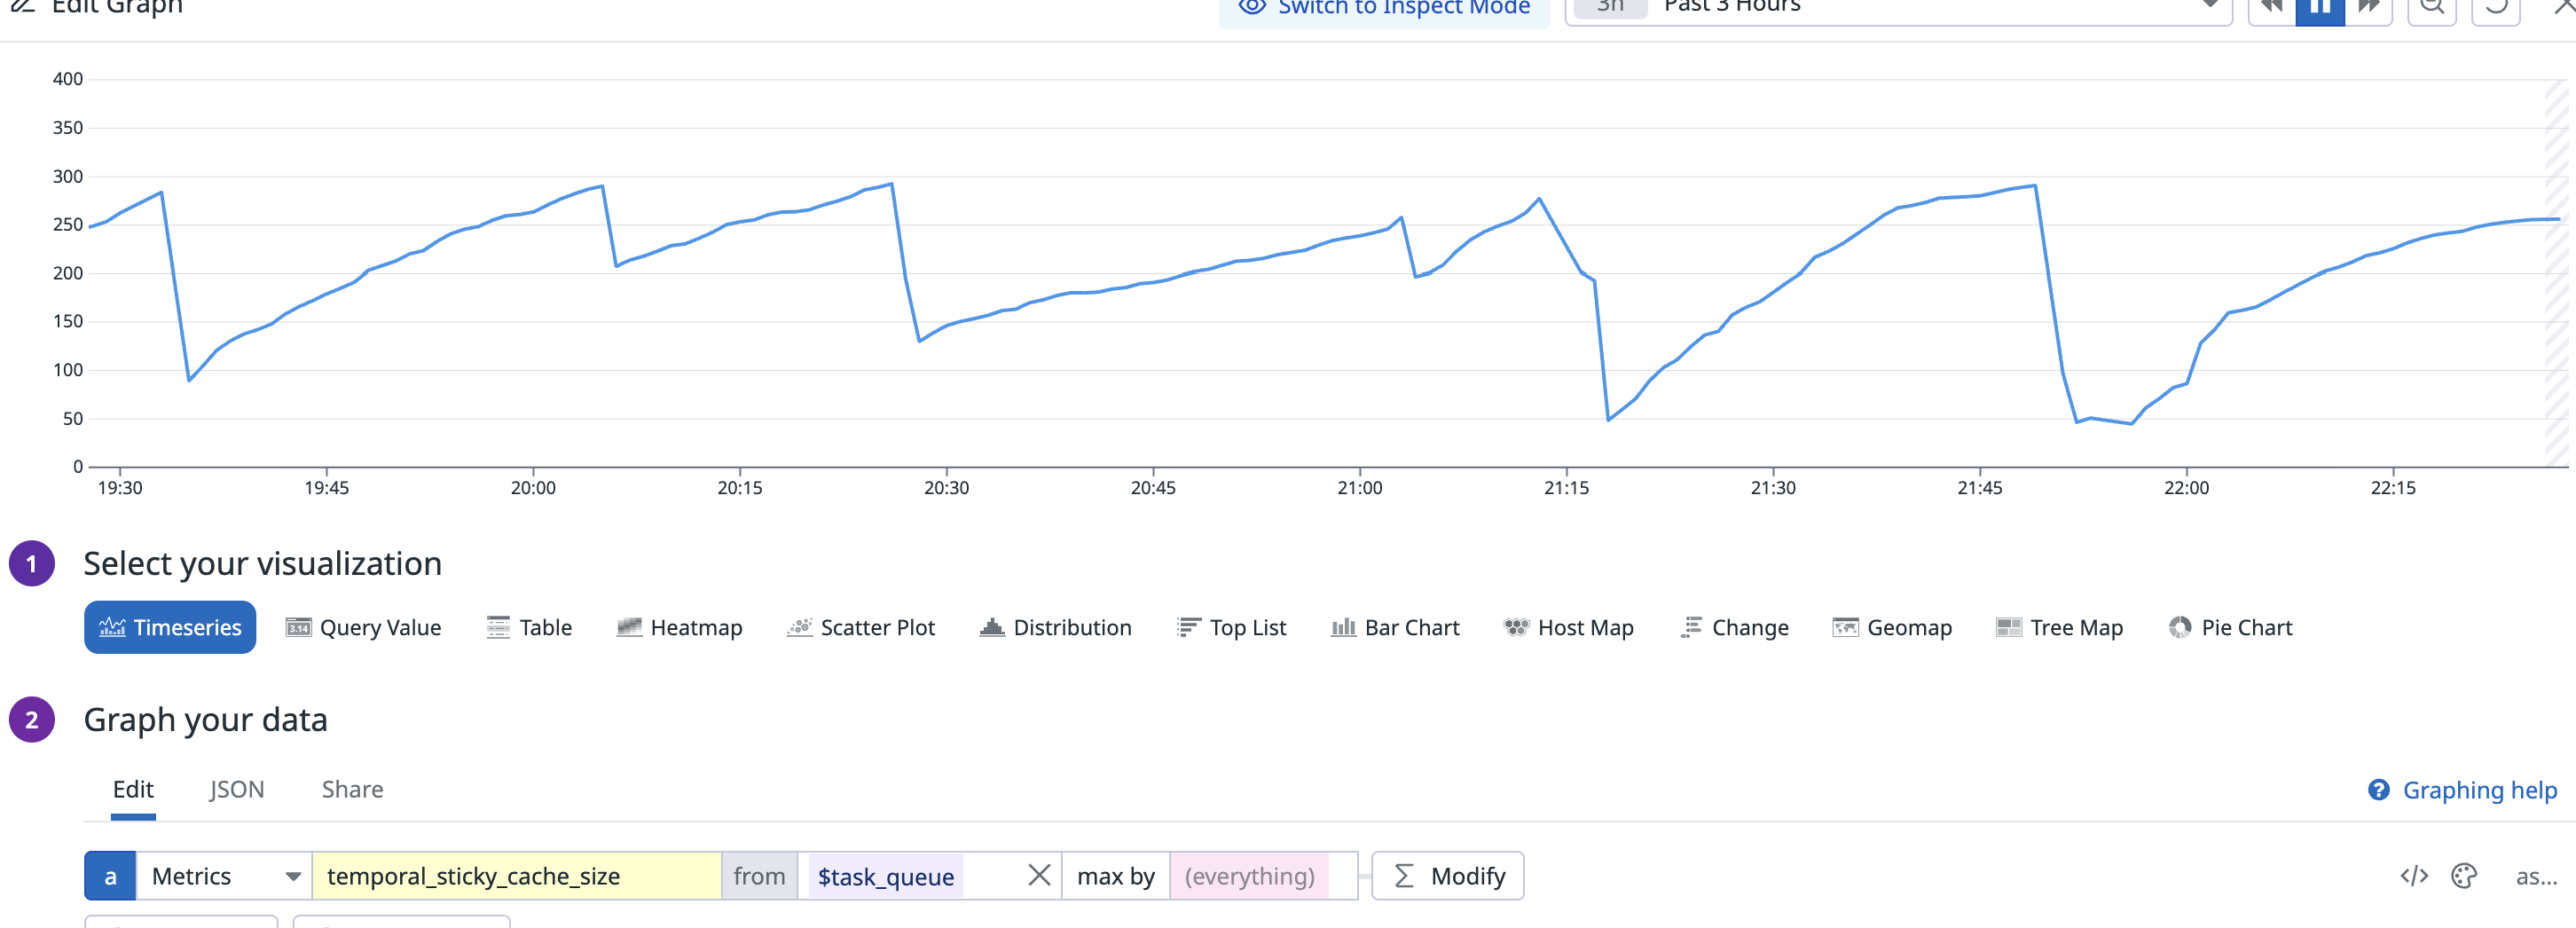
The temporal_sticky_cache_size metric showed a repeating sawtooth pattern. Workers would start, the sticky cache would fill as workflows got assigned, and then the instance would die. Restart, fill, die. Over and over.
ECS Memory Utilization
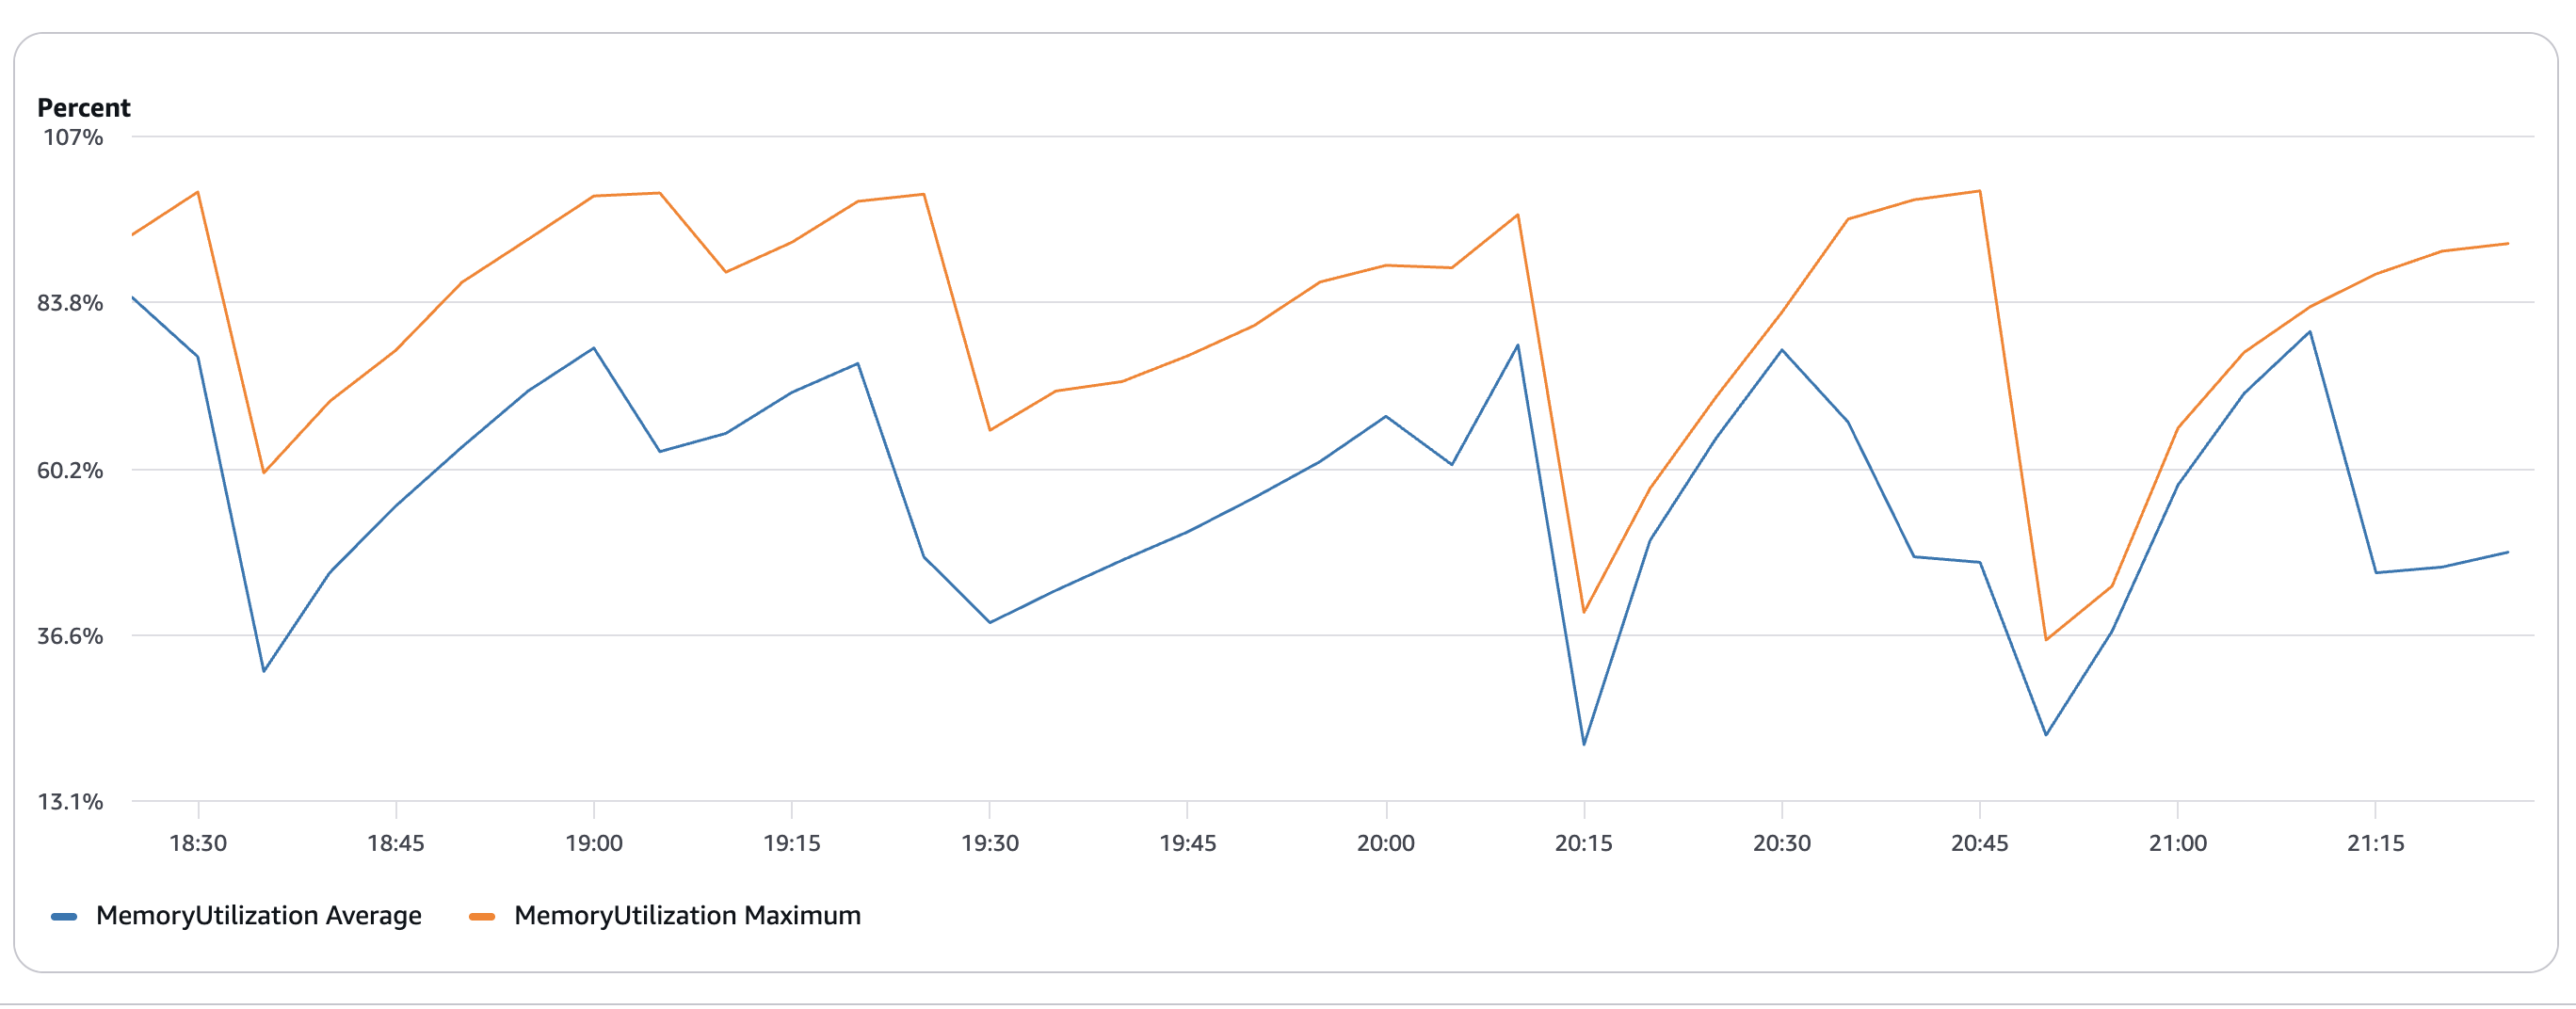
ECS MemoryUtilization told the same story from the infrastructure side. Both average (blue) and maximum (orange) climbed, then dropped sharply as containers were OOM-killed and restarted.
The correlation was clear: memory grew in lockstep with the number of cached workflows. Each workflow the cache absorbed pushed the container closer to its limit. This shifted our thinking from “some bad workflow is exploding” to “every cached workflow costs more memory than it should.”
Phase 3: Adding Diagnostics
We were still flying blind on why per-workflow cost had changed. process.memoryUsage() only tells you about the main thread’s V8 heap. We needed visibility into RSS (total process memory) to see what’s happening outside the heap.
We added a 10-second interval logger:
setInterval(() => {
  const mem = process.memoryUsage()
  const heapUsedMb = Math.round(mem.heapUsed / 1024 / 1024)
  const rssMb = Math.round(mem.rss / 1024 / 1024)
  const externalMb = Math.round(mem.external / 1024 / 1024)
  const arrayBuffersMb = Math.round(mem.arrayBuffers / 1024 / 1024)
  const estimatedNativeMb = Math.max(0, rssMb - heapUsedMb - externalMb - arrayBuffersMb)

  console.log('Worker diagnostics', {
    workerState: getState?.(),
    workerStatus: getStatus?.(),
    heapUsedMB: heapUsedMb,
    rssMB: rssMb,
    estimatedNativeMB: estimatedNativeMb,
    rssDeltaMB: rssMb - previousRssMb,
    heapUsedDeltaMB: heapUsedMb - previousHeapUsedMb,
  })
}, 10_000)
The workerStatus was key - it gives numCachedWorkflows, which let us correlate memory with cache size numerically, not just visually.
First Diagnostic Results (12 workflow task slots)
| Cached WFs | Heap (MB) | RSS (MB) | Native (MB) | Delta/10s (MB) |
|---|---|---|---|---|
| ~20 | 280 | 1,389 | ~1,100 | — |
| ~80 | 300 | 2,950 | ~2,650 | +780 |
| ~100 | 314 | 3,697 | ~3,383 | +374 |
| killed |
Two immediate observations:
- Heap was fine. 280-314 MB, stable. The V8 garbage collector was doing its job.
- RSS was exploding. Growing by 400-800 MB every 10 seconds. All outside the heap.
The gap between RSS and heap (what we called “native” memory) was the problem. This includes the Temporal Rust Core bridge, V8 worker thread heaps, and compiled code. But 3.3 GB of “native” memory was absurd.
Phase 4: Reducing Configuration
Hypothesis: Too Many Concurrent Workflow Tasks
Maybe 12 concurrent workflow slots created too many V8 isolates at once.
Test: Reduced workflowTaskSlotSupplier.numSlots from 12 to 6.
Result:
| Cached WFs | Heap (MB) | RSS (MB) | Native (MB) | Delta/10s (MB) |
|---|---|---|---|---|
| 61 | 247 | 1,597 | 1,320 | +434 |
| 111 | 230 | 2,176 | 1,922 | +579 |
| 124 | 243 | 3,200 | 2,931 | +1,024 |
| killed |
Still crashing. Slower, but same pattern. The cache fills to 124 in ~40 seconds, RSS hits 3.2 GB, OOM.
In hindsight this was obviously not the issue since V8 isolates are reused.
What the Data Told Us
From snapshots 1 to 2: 50 more cached workflows cost +602 MB of native memory. That’s ~12 MB per cached workflow.
With reuseV8Context: true, the Temporal SDK shares a single V8 context across all workflows per thread. Per-workflow memory should be ~1 MB (just the workflow’s local state). 12 MB was 12x too high.
Cross-Reference: The Enrich Service
Our other Temporal worker (enrich service) uses the same @enginy/common package, the same AI SDK v6, and has maxCachedWorkflows: 350 with less container memory (3.5 GB). It wasn’t crashing.
This told us the problem was specific to what’s inside the conversation workflow bundle, not the shared infrastructure.
Phase 5: Finding the Root Cause
With the per-workflow cost established at ~12 MB and the enrich service working fine, we turned to the workflow bundle itself.
Temporal workflow code doesn’t run directly from your source files. Instead, the Temporal TypeScript SDK uses webpack to produce a self-contained workflow-bundle.js (or you can generate it at build time like we do). This bundle is what gets loaded into V8 worker thread isolates.
The reason for this separate bundling step is determinism: the SDK needs to control the execution environment inside the isolate, patching non-deterministic APIs like Date() and Math.random() with deterministic replacements so that workflow replay produces identical results. Activities run on the main thread and can import anything normally, but workflow code can only access what’s in the bundle.
This means whatever ends up in the bundle gets loaded into every V8 worker context. And anything that shouldn’t be there - that wasn’t there before - directly inflates per-workflow memory cost.
What was in the conversation bundle that wasn’t in the enrich bundle?
We grepped the built workflow-bundle.js:
grep -n 'gpt-tokenizer\|creditsCostCalculator\|encodeChat' conversation/dist/workflow-bundle.jsThe result was damning. The entire gpt-tokenizer package - including its ~2 MB BPE rank tables with 200,000 tokenizer merge rules - was embedded in the workflow bundle. This data gets decoded into ~20 MB+ of in-memory JavaScript objects when the V8 context evaluates the bundle.
Before the fix:
- Bundle size: ~12 MB
- Heavy-module hits in bundle: 96 (
ai-sdk/ tokenizer related)
The Import Chain
The workflow code legitimately imports utilities from @enginy/common/browser:
// conversation/src/workflows/utils/conversationIdentityActionsReceiver.ts
import { getMillisecondsToNextWorkingHour, isInWorkingHours } from '@enginy/common/browser'
browser.ts is a barrel file with ~130 exports. A recent commit (8ecd24ed9, Feb 5 - “AI Variable Credits Not Showing Full Cycle Cost”) had added one line:
export { getPromptCreditCost } from './credits/creditsCostCalculator'creditsCostCalculator.ts imports encodeChat from gpt-tokenizer. No workflow code uses getPromptCreditCost. Webpack should have tree-shaken it out.
Why Tree-Shaking Failed
grep 'sideEffects' common/package.json
# (empty)@enginy/common’s package.json had no sideEffects field. Without "sideEffects": false, webpack must assume that importing any export from a module might trigger side effects. It can’t safely remove getPromptCreditCost because the act of importing creditsCostCalculator.ts might do something important (register a global, modify a prototype, etc.).
So webpack included creditsCostCalculator.ts, which pulled in gpt-tokenizer, which pulled in its BPE rank tables, encoding params, model maps, and everything else.
The Fix
Added one field to common/package.json:
{
  "sideEffects": false
}
This tells webpack: “every module in this package is pure - if you don’t use an export, you can safely remove it.” Webpack then tree-shakes getPromptCreditCost and its entire dependency chain (gpt-tokenizer) out of the workflow bundle.
After rebuild:
- Bundle size: ~2.9 MB
- Heavy-module hits: 0
After the Fix (Runtime)
| Cached WFs | Heap (MB) | RSS (MB) | Native (MB) | Delta/10s (MB) |
|---|---|---|---|---|
| 0 | 195 | 501 | 285 | — |
| 4 | 192 | 535 | 322 | +34 |
| 29 | 199 | 543 | 322 | +5 |
| 78 | 214 | 638 | 386 | +2 |
| 92 | 189 | 593 | 376 | +1 |
92 cached workflows at 593 MB RSS. Before the fix, 61 cached workflows was already 1,597 MB. Per-workflow cost dropped from ~12 MB back to ~1 MB.
The base RSS dropped from ~1,200 MB to ~500 MB - the gpt-tokenizer tables were consuming ~700 MB just being loaded into the two V8 worker thread contexts.
Lessons
-
sideEffects: falsematters. If you maintain a shared library consumed by webpack, declare it. Without it, a single barrel export can drag megabytes of unrelated code into your bundle. In our case, a tokenizer that no workflow ever calls. -
Barrel exports are a liability in bundled contexts. Our
browser.tshas 130+ exports. Any one of them can pull in unexpected transitive dependencies. For performance-critical bundles like Temporal workflow bundles, consider importing from specific subpaths instead of barrels. -
process.memoryUsage().heapUsedonly covers the main thread. In Temporal workers, activities run on the main thread while workflows run in separate V8 worker threads. If heap is stable but RSS climbs, that tells you the problem lives in the workflow threads (bundle, V8 worker contexts), not in activity code. It narrows where to look, but the actual root cause still requires inspecting the bundle and correlating memory with workload counters. -
The Temporal
workerStatusobject is invaluable.numCachedWorkflowslet us correlate memory growth with cache size, which pointed us toward per-workflow cost as the problem. -
Inspect built artifacts, not only source. The bug was invisible in the source code - no workflow imports
gpt-tokenizer. Only by grepping the builtworkflow-bundle.jsdid we find the 12 MB of dead weight. When memory regressions appear after a deploy, validate what actually lands in the bundle. -
The investigation loop works. Every phase followed the same pattern: form a hypothesis based on available data, design a minimal test, deploy, observe. Most hypotheses were wrong. That’s fine - each one narrowed the search space.
Further reading
After fixing the conversation worker, I investigated the same class of problem in our enrich service. That one had no single-line fix - it turned into a bundle experiment log. You can read about it in the enrich deep dive.
Comments
Leave a Comment